Bus Occupancy Levels Prediction
Engineering graduation project (PFE) centered on predictive modeling for public transit occupancy. Engineered a GTFS-driven passenger flow simulation engine and developed a dual-horizon forecasting framework—combining XGBoost for macro planning with sequential LSTM networks for real-time stop-by-stop predictions, delivered via a full-stack production ecosystem.
The Problem: Why A Single Forecast Horizon Isn't Enough
Public transit authorities face chronic challenges balancing vehicle supply with passenger demand. Overcrowded buses lead to passenger discomfort, missed stops, and delayed dwell times, while underutilized vehicles drain fuel and municipal budgets.
A key insight of this research is that predicting passenger occupancy requires two fundamentally distinct operational horizons:
Predicts average occupancy per transit route and hour, days to weeks in advance. Enables operators to allocate bus capacities, adjust service frequencies, and schedule driver shifts based on weather forecasts, calendar events, and weekly seasonality.
Predicts dynamic passenger levels stop-by-stop along an active bus run in real time. Ingests immediate trajectory history (the last 15 consecutive stops) to inform waiting commuters and dispatch control rooms of real-time seat availability.
Data Acquisition & Physics Flow Engine (FlowEngine)
High-granularity passenger sensor logs are frequently proprietary or unavailable in public repositories. To construct a realistic, end-to-end benchmark dataset without compromising real-world physical constraints, we integrated standard transit feeds with meteorological observations and built a rigorous physical simulation engine:
GTFS Transit Specification (Merced "The Bus" Network)
Extracted complete transit feeds from Mobility Database (mdb-3117): 13 bus routes (university shuttles, urban lines, suburban connectors), 363 stops with exact GPS coordinates, detailed trip plans, and calendar schedules.
Meteorological Telemetry Ingestion
Collected hourly environmental parameters (temperature, precipitation, visibility, and atmospheric conditions) from WeatherSpark and AccuWeather historical data, mapped directly to trip timestamps.
Physical Flow Simulation Engine (FlowEngine)
Simulated realistic numbers of passengers getting on and off each bus based on real-world behavior and practical constraints:
- Stop Location & Type: Grouped stops into categories like University Campus, Hospitals, Shopping Centers, and Residential neighborhoods so passenger flow matches the area.
- Daily Rush Hours: Replicated typical morning (07:30–09:00) and evening (16:30–18:30) commuter spikes aligned with workday and class timetables.
- Weather & Calendar Impact: Factored in how weather shifts daily habits. For example, during heavy rain or severe cold, campus attendance noticeably drops as students skip classes or stay home, directly lowering ridership on university routes.
- Bus Capacity Limits: Enforced realistic limits so a bus can never exceed its physical capacity, with passenger boarding naturally slowing down as the bus fills up.
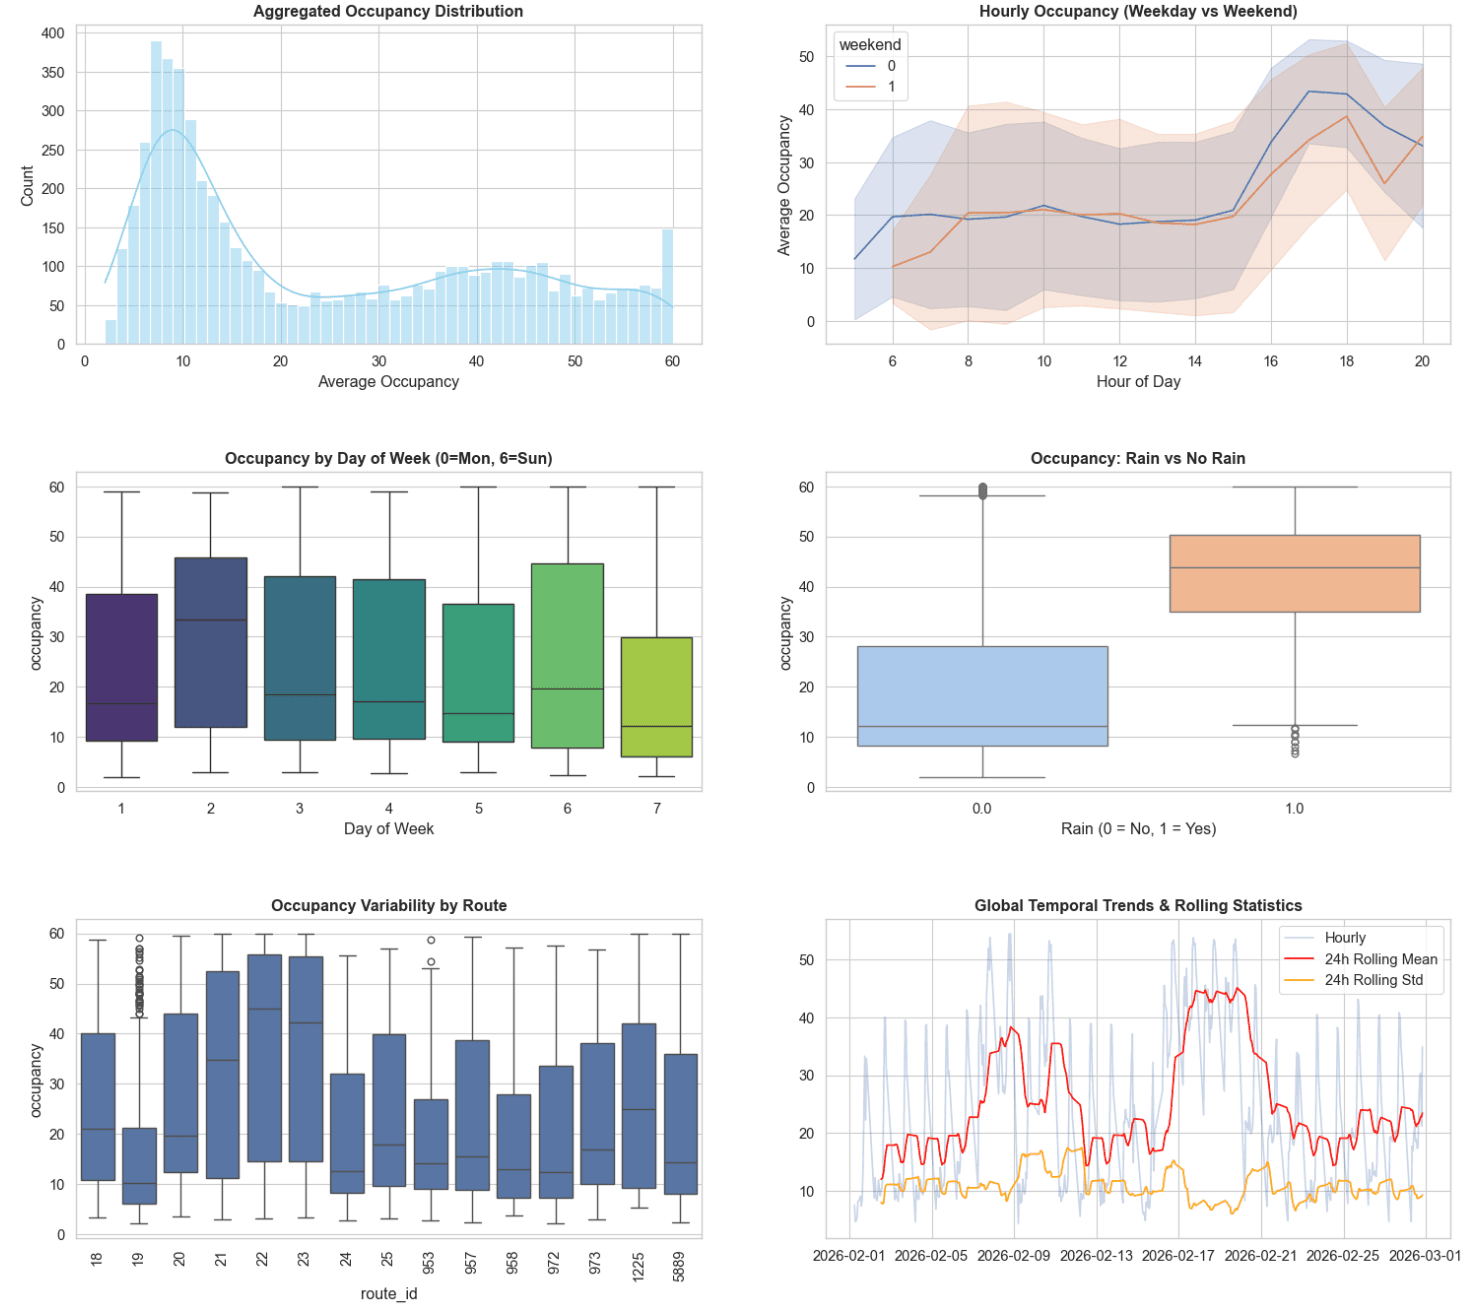
Figure 14: Comprehensive 6-Panel EDA Grid (Distribution, Hourly Curves, Day-of-Week Variation, Rain Impact, Route Volumes, Rolling Stats).
Exploratory Data Analysis & Empirical Signatures
In-depth statistical exploration revealed strong multi-scale periodicities, spatial asymmetries, and climate sensitivities in transit ridership:
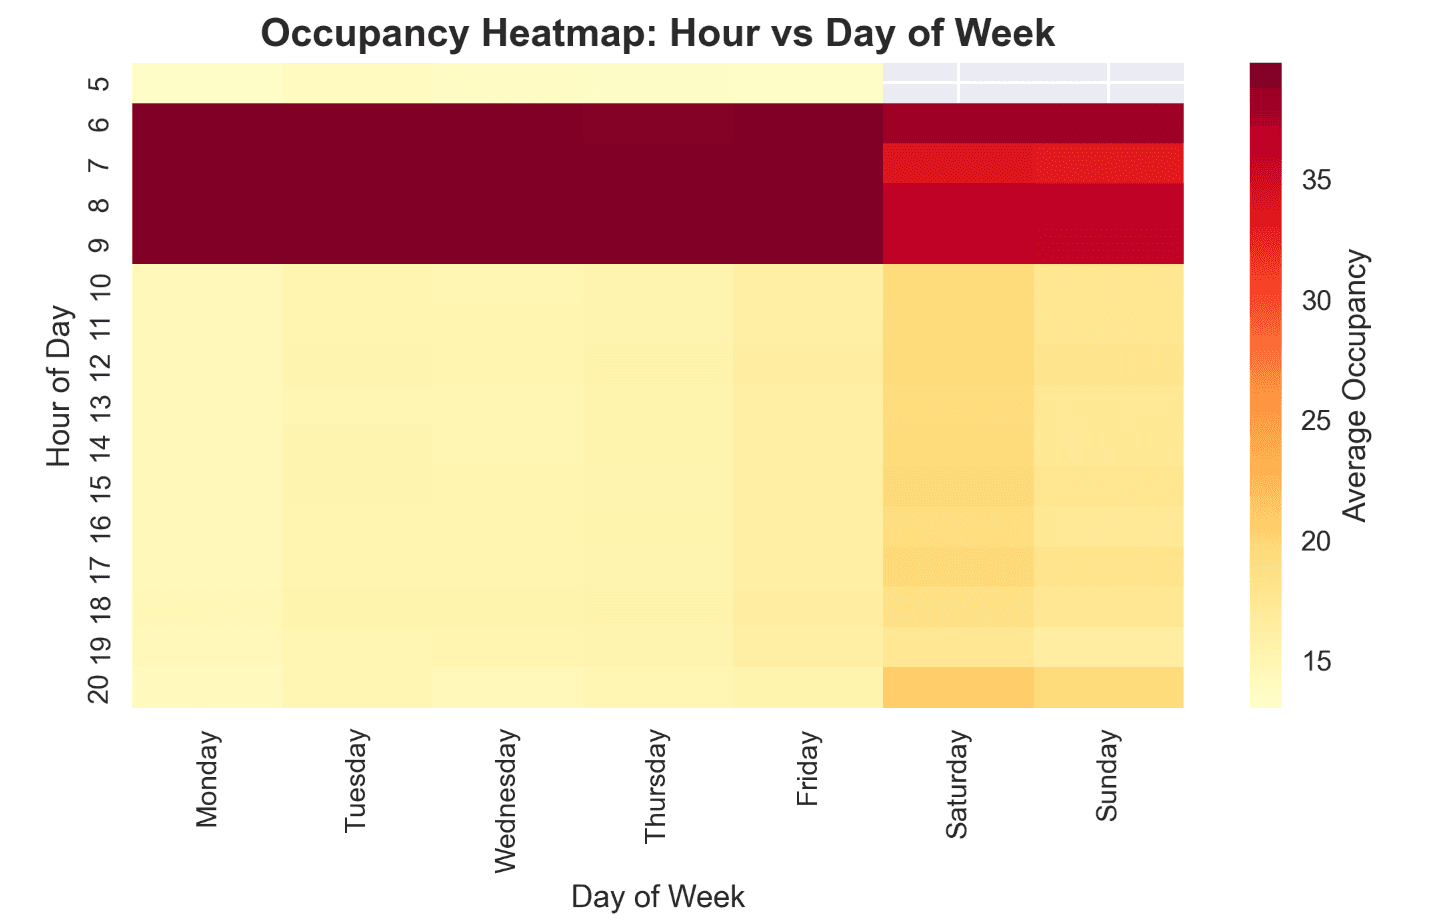
Hour vs. Day-of-Week Occupancy Heatmap
Highlights intense weekday morning (8h) and late afternoon (17h–18h) commute corridors, contrasting with smoother, lower-density weekend distributions.
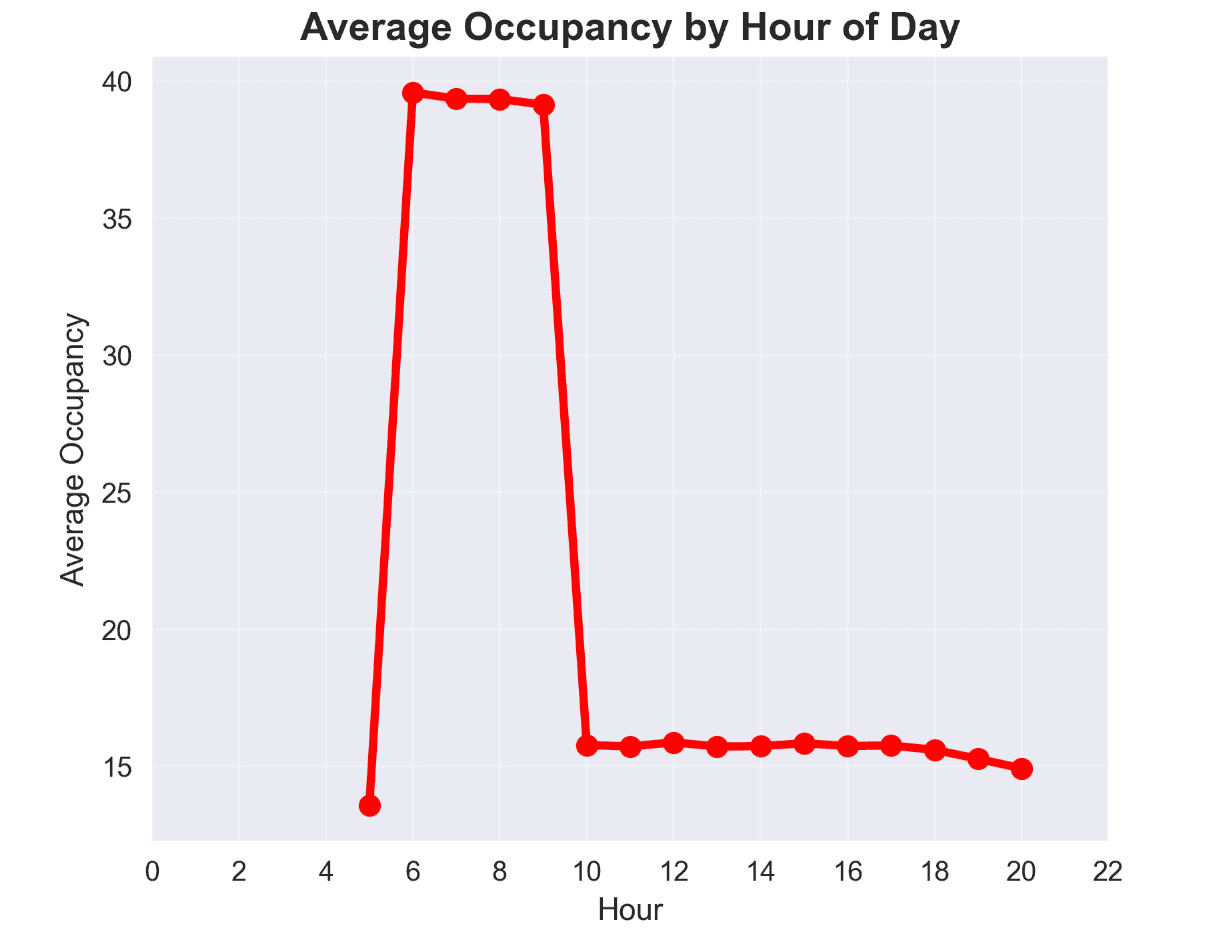
Diurnal Commuter Profiles
Clear bimodal signature reflecting daily urban labor rhythms and student class transitions across the network.
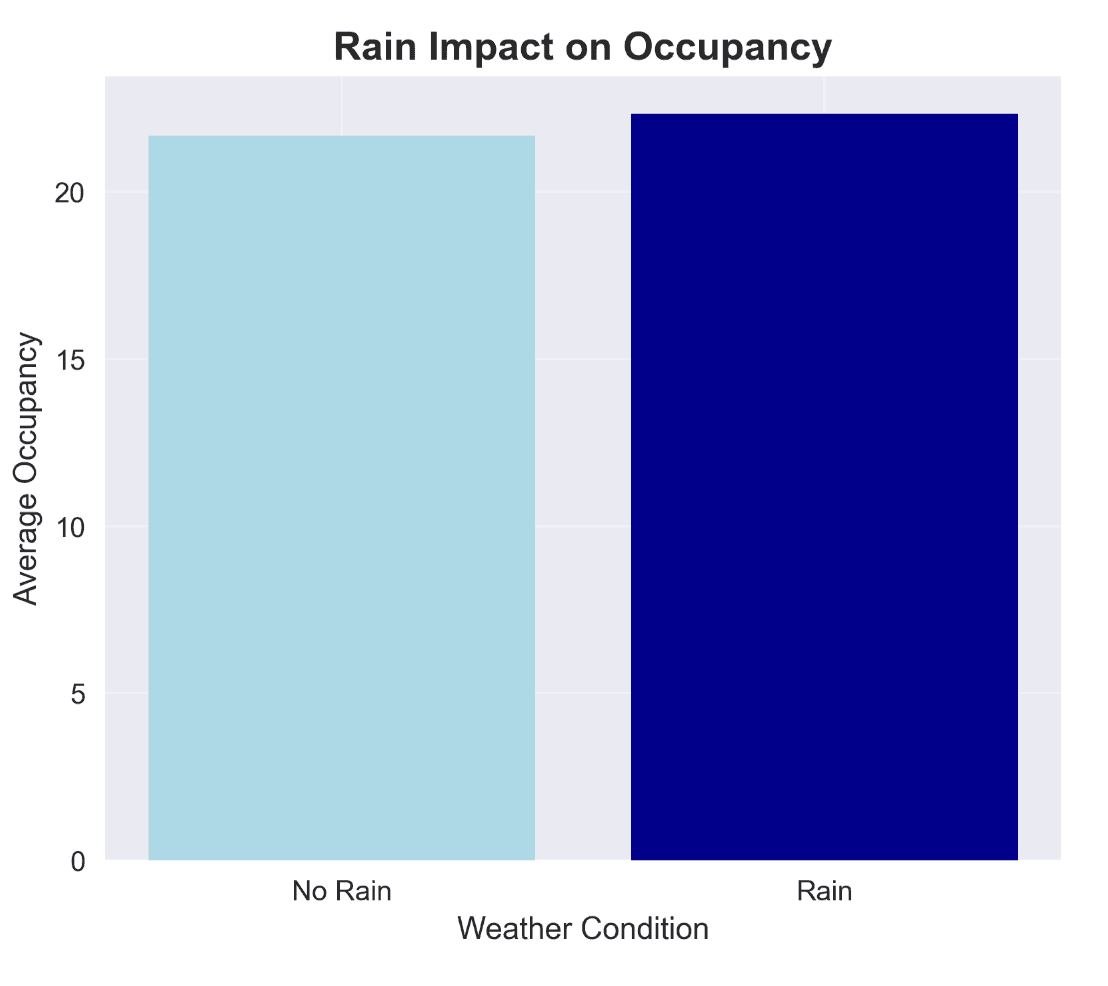
Precipitation & Weather Shift
Rainy conditions systematically increase bus ridership (+18% to +32%) as cyclists and pedestrians seek covered public transport.
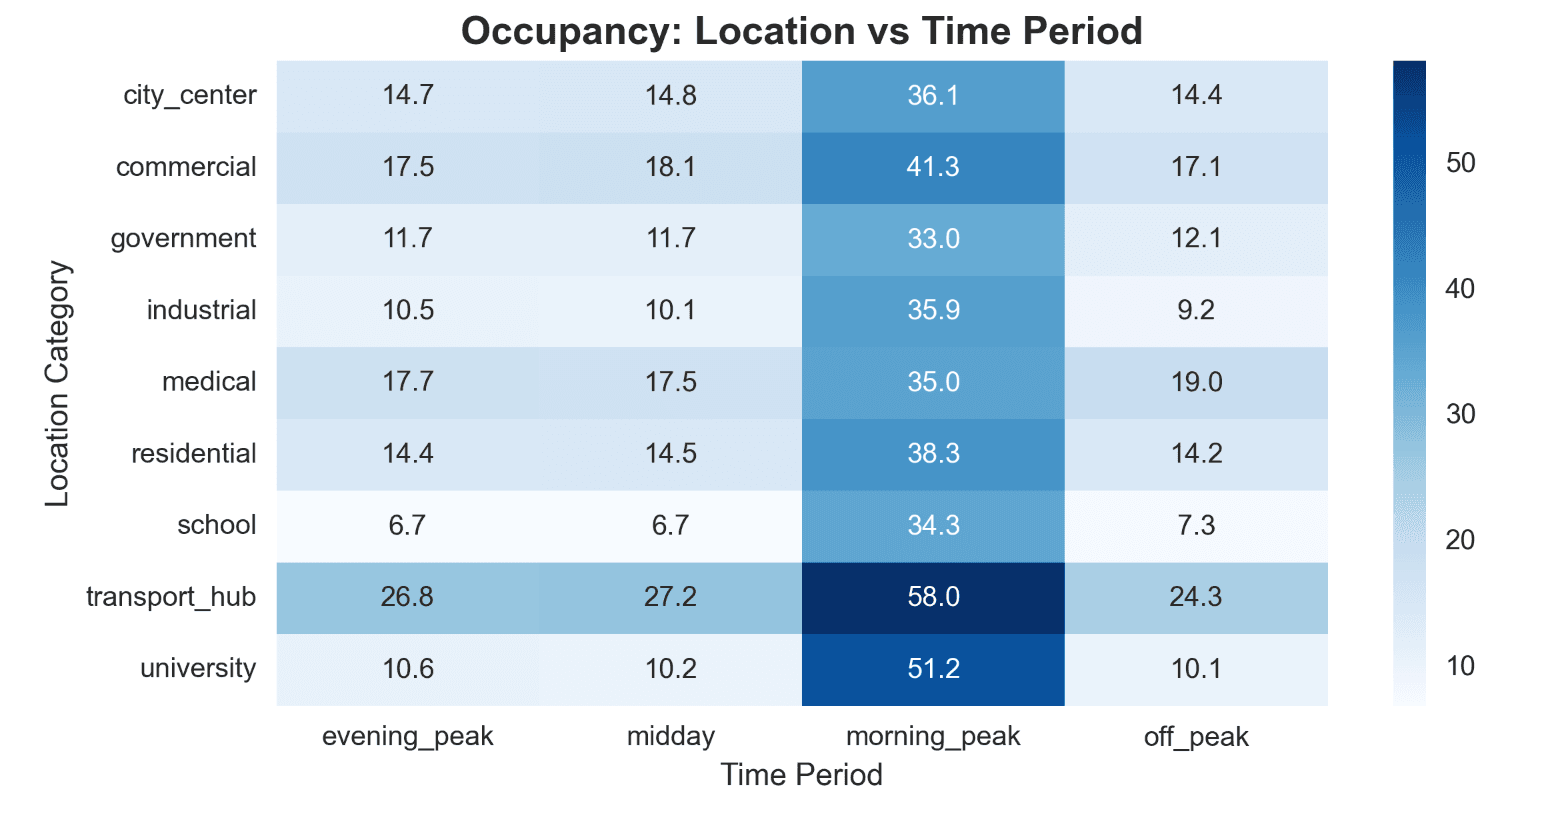
Spatial Demographics Matrix
University and commercial hubs sustain significantly higher peak occupancy compared to suburban and residential transit endpoints.
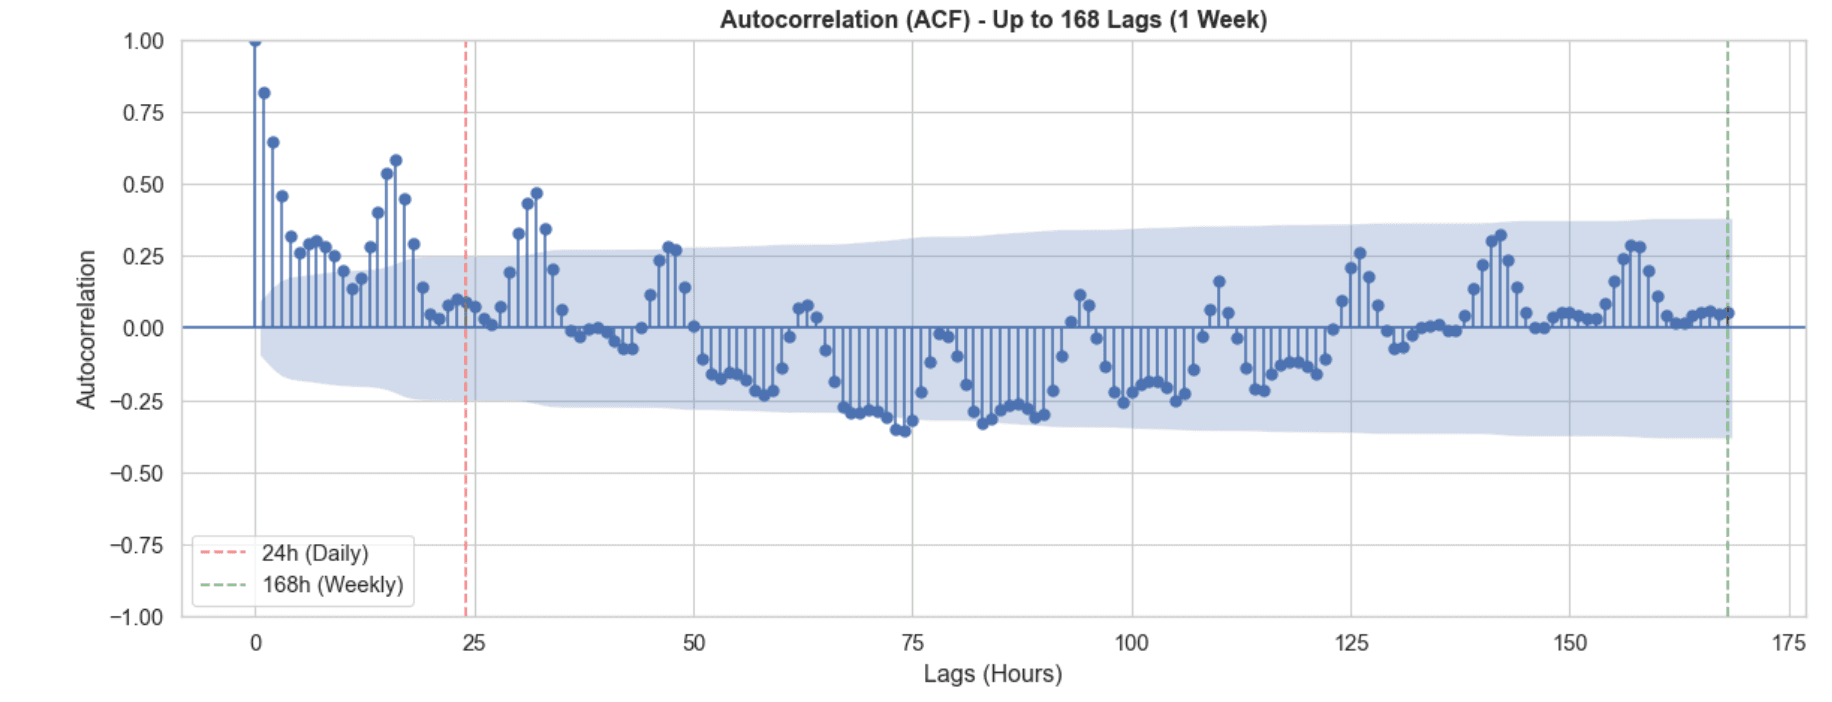
Autocorrelation (ACF up to 168 Lags)
Empirically confirms 24-hour diurnal cyclicity and 168-hour (7-day) weekly periodicity, justifying time-series lag structures.
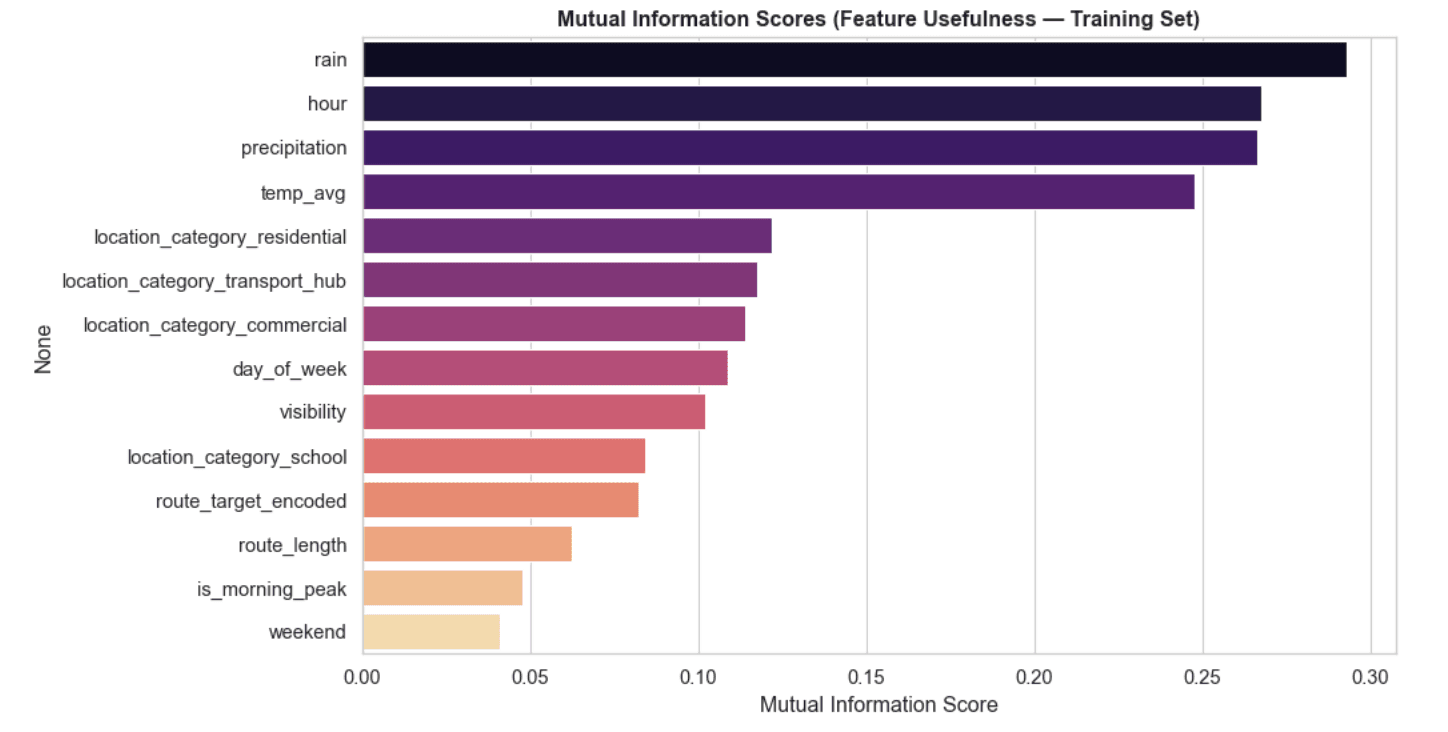
Mutual Information Scores
Quantifies the primary predictive power of hourly cyclicity, meteorological factors, stop sequence position, and target-encoded routes.
Predictive Modeling & Architectures
Time-Based Data Splitting (Preventing Data Leakage)
With time-series data, you cannot shuffle records randomly, otherwise the model "cheats" by looking at future events to predict the past (known as data leakage). To keep testing 100% realistic, the data was split strictly by timeline: earlier months for training (70% for long-term, 80% for short-term), the next period for tuning (15% / 10%), and the most recent unseen days for final evaluation (15% / 10%). All feature scaling and transformations were fitted only on the training set so the model never received hints from the future.
Long-Term Forecasting: Model Exploration
I tested multiple algorithms to forecast hourly route demand, comparing simple baselines, neural networks, and decision tree ensembles. Through systematic validation and tuning, Optimized XGBoost proved to be the strongest model, best handling the tabular relationships between weather, time of day, and passenger volume.
Short-Term Forecasting: The "Pure LSTM" Approach
Instead of feeding the neural network cluttered manual features that caused noise, I built a "Pure LSTM" model that receives only the raw sequence of the last 15 stops. This allowed the recurrent network to naturally learn how passengers board and alight over time, achieving exceptional real-time accuracy with an R² score of 0.928.
Empirical Results & Quantitative Benchmarks
1. Long-Term Route Forecasting Benchmark (Test Set)
| Model | Horizon | MAE (Passengers) | RMSE | R² Score |
|---|---|---|---|---|
| Baseline Average | Route/Hour | 12.84 | 18.65 | 0.000 |
| Ridge Regression | Route/Hour | 8.85 | 13.20 | 0.501 |
| Random Forest | Route/Hour | 7.34 | 11.62 | 0.613 |
| Multi-Layer Perceptron (MLP) | Route/Hour | 7.15 | 11.45 | 0.624 |
| Optimized XGBoost (Best) | Route/Hour | 6.76 | 10.87 | 0.661 |
2. Short-Term Sequential Trajectory Benchmark (Test Set)
| Architecture | Input Structure | MAE (Passengers) | RMSE | R² Score |
|---|---|---|---|---|
| LSTM de Base (Non-Tuned) | Short window + Lags | 3.56 | 5.56 | 0.907 |
| LSTM Optimisé (2 Layers) | Short window + Lags | 3.51 | 5.55 | 0.907 |
| Pure LSTM (Extended Sequence) | 15 Raw Consecutive Stops | 3.05 | 4.87 | 0.928 |
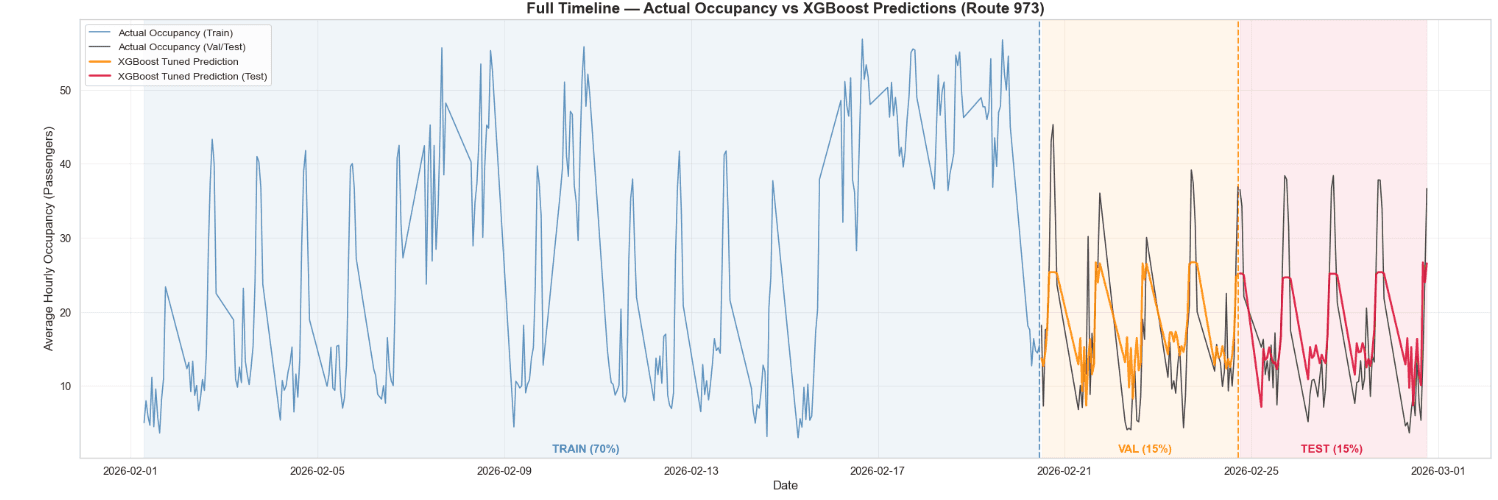
Figure 22: Full Timeline of Actual Occupancy vs. XGBoost Predictions across Chronological Train (Blue), Validation (Orange), and Test (Red) sets.
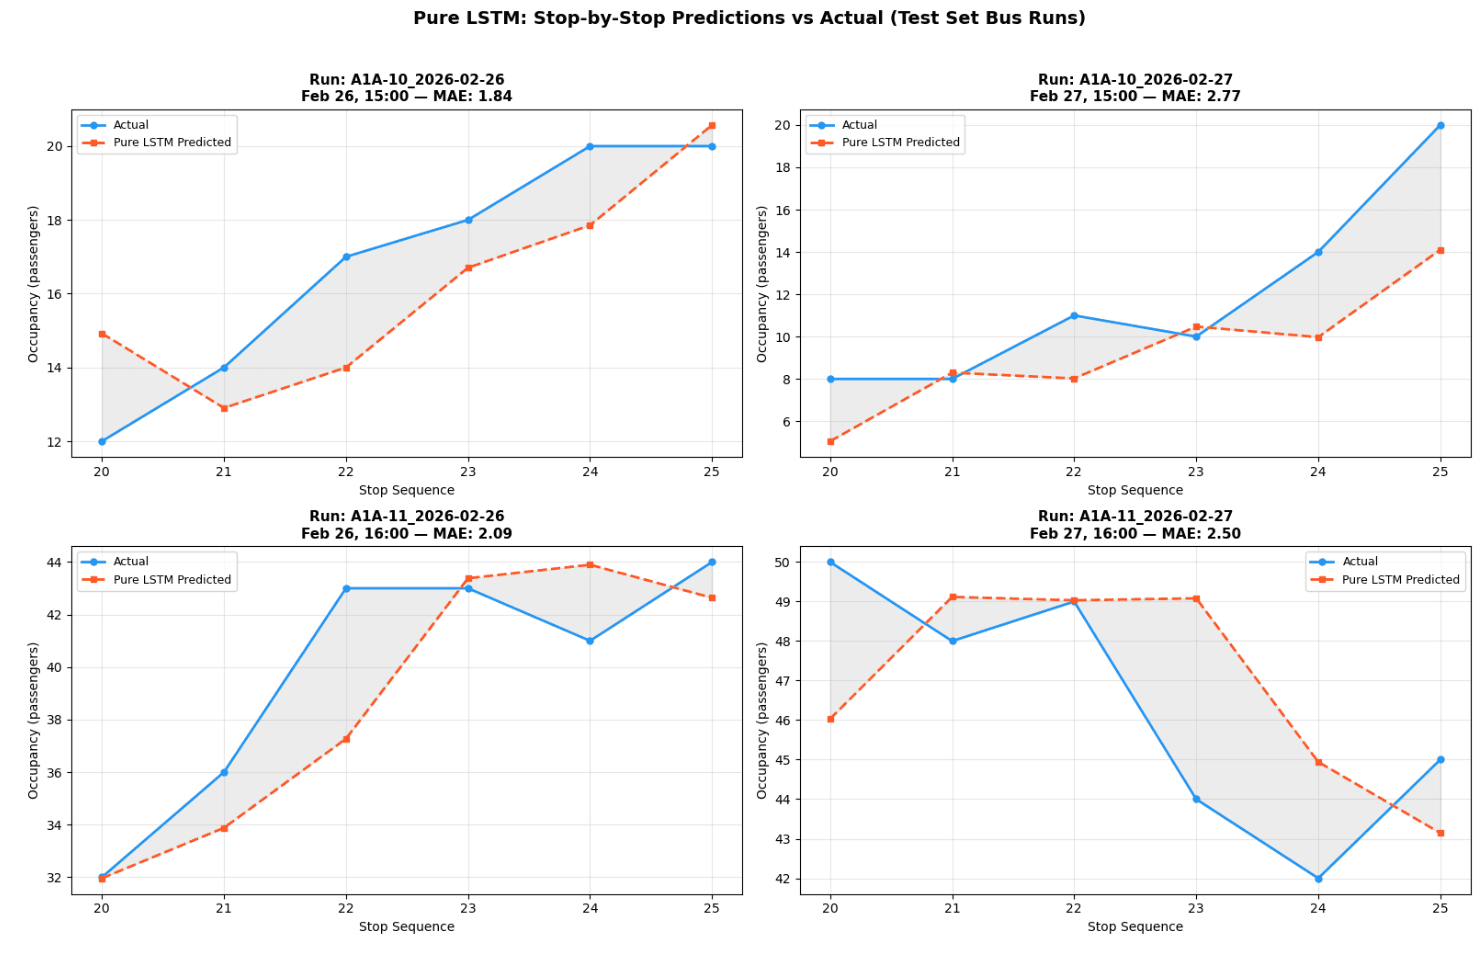
Figure 27: Pure LSTM Stop-by-Stop Trajectory Predictions vs. Ground Truth across sample test bus runs (shaded areas indicate minimal absolute residual errors).
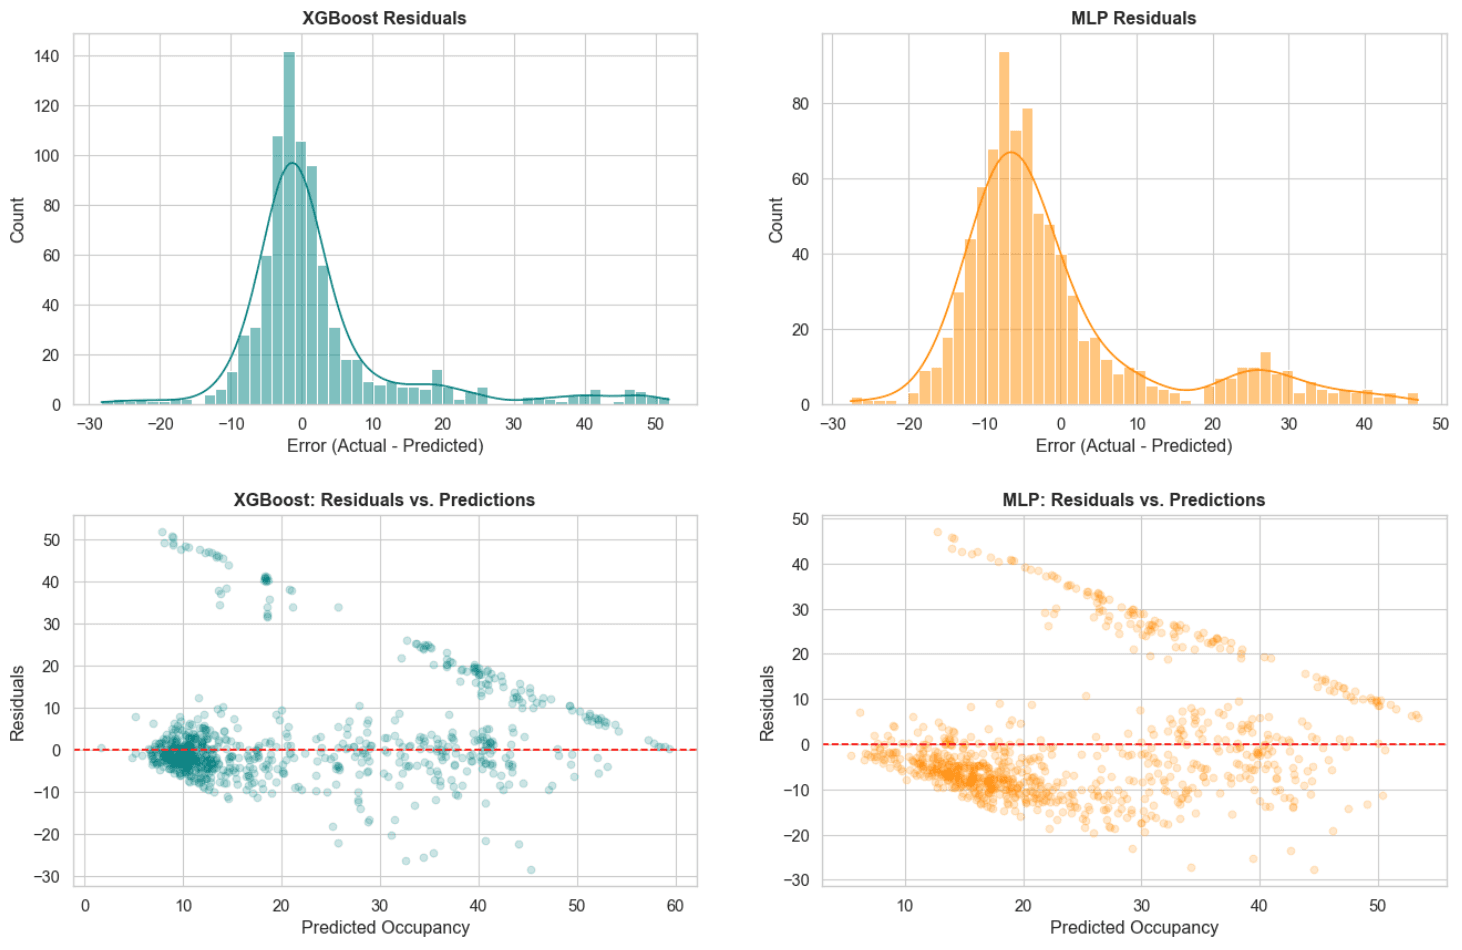
Residual Error Distribution
Demonstrates funnel-shaped heteroscedasticity: error variance scales with higher passenger counts during severe rush-hour surges.
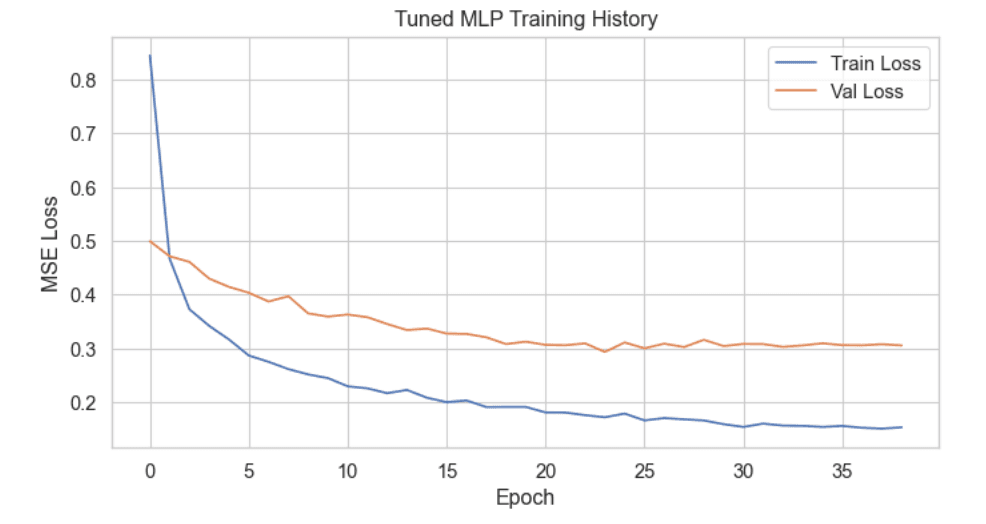
Deep MLP Training Convergence
Smooth MSE loss convergence with EarlyStopping and ReduceLROnPlateau preventing overfitting across validation splits.
Beyond Notebooks: The Production Ecosystem
I didn't want to stop at just training models in notebooks. To make the predictions truly accessible and useful in the real world, I built the complete ecosystem around them:
FastAPI Microservice ( Backend API)
Orchestrates model inference smoothly, exposing fast, low-latency endpoints to serve real-time stop predictions and long-term route forecasts on demand.
React Native Commuter App ( Mobile App)
Designed for everyday passengers to check live occupancy levels along their route so they know whether a bus is packed before stepping out the door.
Next.js Operator Portal ( Web Dashboard)
A command center for transit authorities to analyze network-wide demand trends, monitor rush-hour bottlenecks, and optimize fleet dispatching schedules.
Key Findings & Engineering Lessons
1. Trust Recurrent Network Cell States over Hand-Crafted Lags
Feeding manual lag features into an LSTM actually degraded performance. Giving the LSTM an uninterrupted 15-stop raw historical sequence allowed it to construct cleaner temporal representations autonomously.
2. Respect Chronological Boundary Conditions
Random k-fold validation produces artificially inflated metrics in time-series modeling. Strict forward-chaining splits and training-only target encoding are mandatory for production-grade reliability.
3. Complementary Dual-Model Deployment
XGBoost and LSTM are not competitors: XGBoost provides operational planners with reliable weekly dispatch guidance, while LSTM provides dynamic in-journey telemetry for waiting riders.
4. Managing Covariate Shift & Extreme Surge Outliers
Seasonal temperature drifts between winter and spring introduce domain shift. Future iterations can integrate Attention-based Temporal Fusion Transformers (TFT) and domain adaptation to dynamically weigh shifting weather regimes.
Acknowledgements & Gratitude
A heartfelt thank you to my thesis supervisor, Prof. Abderrahmane EL METTITI, for his guidance, mentorship, and encouragement throughout this project. I am also deeply grateful to the jury members, Prof. Rachid SAADANE and Prof. Hasna CHAIBI, for their valuable insights, critique, and feedback during the defense. Finally, immense gratitude to my family and friends for their constant support throughout my engineering studies.